UNITED STATES
SECURITIES AND EXCHANGE COMMISSION
WASHINGTON, D.C. 20549
FORM N-CSRS
CERTIFIED SHAREHOLDER REPORT OF REGISTERED
MANAGEMENT INVESTMENT COMPANIES
|
Investment Company Act file number:
|
811-08025
|
| |
|
Global Income Fund, Inc.
(Exact name of registrant as specified in charter)
11 Hanover Square, New York, NY 10005
(Address of principal executive offices) (Zipcode)
John F. Ramírez, Esq.
11 Hanover Square
New York, NY 10005
(Name and address of agent for service)
Registrant's telephone number, including area code: 1-212-344-6310
Date of fiscal year end: 12/31
Date of reporting period: 1/1/10 - 06/30/10
Form N-CSRS is to be used by management investment companies to file reports with the Commission not later than 10 days after the transmission to stockholders of any report that is required to be transmitted to stockholders under Rule 30e-1 under the Investment Company Act of 1940 (17 CFR 270.30e-1). The Commission may use the information provided on Form N-CSRS in its regulatory, disclosure review, inspection, and policy making roles.
A registrant is required to disclose the information specified by Form N-CSRS and the Commission will make this information public. A registrant is not required to respond to the collection of information contained in Form N-CSRS unless the Form displays a current valid Office of Management and Budget ("OMB") control number. Please direct comments concerning the accuracy of the information collection burden estimate and any suggestions for reducing the burden to Secretary, Securities and Exchange Commission, 450 Fifth Street, NW, Washington, DC 20549-0609. The OMB has reviewed this collection of information under clearance requirements of 44 U.S.C. sec. 3507.
Item 1. Report to Stockholders.
PORTFOLIO ANALYSIS*
| |
Currency Allocation |
|
Bond Ratings
|
|
| |
|
|
|
|
|
|
| |
|
|
|
AAA |
8% |
|
| |
|
|
|
|
|
|
| |
U.S. Dollars** |
79% |
|
AA |
4% |
|
| |
|
|
|
|
|
|
| |
Euros |
16% |
|
A |
13% |
|
| |
|
|
|
|
|
|
| |
Australian Dollars |
7% |
|
BBB |
7% |
|
| |
|
|
|
|
|
|
| |
Canadian Dollars |
2% |
|
<BBB |
1% |
|
| |
|
|
|
|
|
|
| |
British Pounds |
2% |
|
Non-bond investments |
73% |
|
| |
|
|
|
|
|
|
| |
|
106% |
|
|
106% |
|
|
*
|
Country allocation and portfolio analysis use approximate percentages of net assets and may not add up to 100% due to leverage or other assets, rounding, and other factors. Ratings are not a guarantee of credit quality and may change. U.S. allocation may include U.S. closed end funds with foreign allocations.
|
|
**
|
May include allocation to closed end funds with foreign currency allocations.
|
July 14, 2010
Dear Shareholders:
It is a pleasure to submit this 2010 Semi-Annual Report for Global Income Fund and to welcome our new shareholders who find the Fund’s quality approach attractive. As a reminder, the primary and fundamental objective of the Fund is to provide a high level of income. The Fund’s secondary, non-fundamental investment objective is capital appreciation. The Fund currently pursues its investment objectives by investing primarily in closed end funds that invest significantly in income producing securities and a global portfolio of investment grade fixed income securities.
Global Economic Report
The loss of momentum in the global economic recovery seems to have surfaced at the end of the second quarter more sharply than anticipated, notably in the United States and China. Global manufacturing output has been estimated to have risen by more than 12% from its recession low, but recently is seen to be rapidly decelerating, particularly in the United States, according to the Institute of Supply Management. In keeping its target rate to a range of between 0% and 0.25%, the U.S. Federal Reserve Open Market Committee only modestly reduced its 2010 growth forecast, however, in its June meeting minutes and maintained the same qualitative outlook for a “continued, moderate recovery.” While still impressive, China’s GDP growth slowed in the second quarter to 7.2% annualized from 10.8% in the first quarter, dragged down by the manufacturing sector, which gained only about 0.4% in the first two months of the quarter and apparently contracted in June.
Europe appears to be recovering steadily, although also somewhat slowly. According to Eurostat, the European Union’s statistics agency, in May 2010 compared with May 2009, industrial production rose by 9.4% in the euro area.
In contrast to the United States and Europe, the Bank of Japan raised its 2010 growth outlook at a recent policy meeting in view of growing global demand for technology applications and improving outlooks for both corporate sentiment and profits. In even greater contrast, in the developing economies of India, Korea, Malaysia, Thailand, and Peru, the central banks have recently increased their target interest rates, suggesting that the economic recoveries taking place in those countries are sufficiently robust that a tightening monetary policy would be prudent to slow growth down to more sustainable levels. Similarly, the Bank of China announced in the second quarter that, abandoning a peg price versus the U.S. dollar established in 2008, it would permit the yuan to float against the U.S. dollar after the Chinese currency had risen approximately 16% against the euro during the Greek fiscal crisis.
Global Allocation Strategy
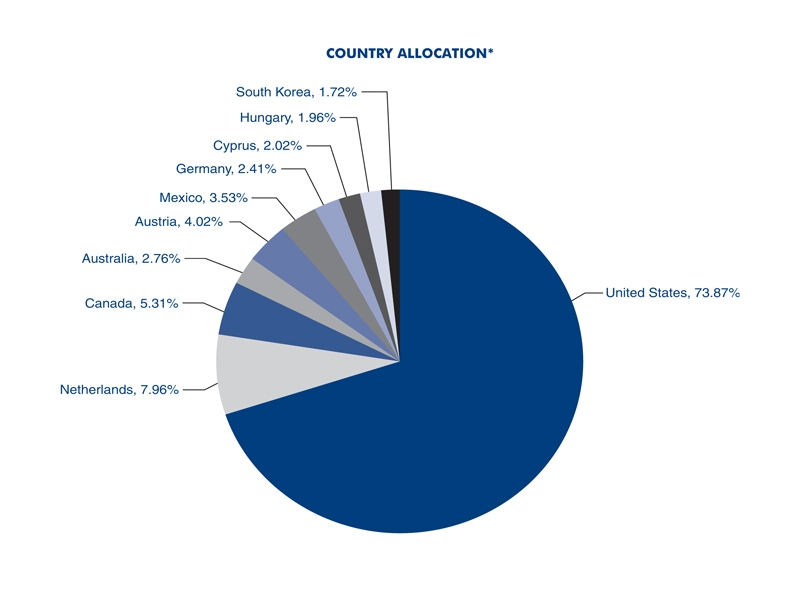
Given this uncertain economic environment, the Fund’s strategy in the first half of 2010 included investing its assets primarily in closed end funds that invest significantly in income producing securities and a global portfolio of investment grade fixed income securities denominated in major world currencies and issued by organizations across many countries. At June 30, 2010, holdings of closed end funds and closed end fund business development companies comprised approximately 60% of the Fund’s investments. In its global portfolio of fixed income securities, the Fund held securities of sovereign nations, corporations, and other organizations based in the United States, Netherlands, Canada, Austria, Mexico, Australia, Germany, Cyprus, Hungary, and South Korea. Approximately 98% of the Fund’s bond investments are considered investment grade by actual or deemed rating.
Of the Fund’s net assets, approximately 79% were denominated in U.S. dollars, 16% in euros, 7% in Australian dollars, 2% in British pounds, and 2% in Canadian dollars (adding up to 106% due to leverage), although it should be noted that some of the closed end funds owned by Global Income Fund may own securities denominated in foreign currencies. In the first six months of 2010, the Fund had a net asset value change of (2.06%) on a market price return per share for the period of (3.15%), reflecting an increased market price discount to net asset value. Recently, the Fund’s net asset value per share was $4.36 and its share closing market price was $3.50. While investment return and value will vary and shares of the Fund may subsequently be worth more or less than their original cost, this represents an opportunity for investors to purchase the Fund’s shares at a discount to their underlying net asset value.
Distribution Policy
Under the current managed distribution policy, distributions of approximately 5% of the Fund’s net asset value per share on an annual basis are paid primarily from net investment income and any net realized capital gains, with the balance representing return of capital. In the first six months of 2010, distributions paid totaled $0.11 per share. As of the date of this letter, the majority, and possibly all, of these distributions are comprised of net investment income and represent net income earned by the Fund in fiscal 2010 and 2009. This is an estimate based on information available at this time and is subject to change. Actual amounts may be re-characterized for tax purposes after the Fund’s fiscal year end. In January, shareholders should receive information concerning the taxable status of the dividend distributions that were paid to shareholders of record in the 12 months ended December 31. The estimated components of each quarterly distribution that include a potential return of capital are provided to shareholders of record in a notice accompanying the distributions. For those shareholders currently receiving the Fund’s quarterly dividends in cash but are interested in adding to their account through the Fund’s Dividend Reinvestment Plan, we encourage you to review the Plan set forth later in this document and contact the Transfer Agent, who will be please to assist you, with no obligation on your part. Our review of the markets indicates that the Fund has benefitted from its quality portfolio strategy, holding income producing investments in multiple currencies and closed end funds that invest significantly in income producing securities. An investment strategy for investors seeking income over the long term, however, may include seeking income in other types of asset classes when appropriate in view of, and proportional to, the perceived and acceptable risks.
As always, we are grateful to the Fund’s long standing shareholders for their continuing support.
| |
Sincerely,

Thomas B. Winmill
President |
|
SCHEDULE OF PORTFOLIO INVESTMENTS – (UNAUDITED)
JUNE 30, 2010
|
Shares
|
|
|
|
Cost
|
|
|
Value
|
|
| |
|
|
|
|
|
|
|
|
| |
|
CLOSED END FUNDS (48.95%)
|
|
|
|
|
|
|
| |
|
United States
|
|
|
|
|
|
|
| |
107,154 |
|
Alpine Global Premier Properties
|
|
$ |
655,087 |
|
|
$ |
577,560 |
|
| |
69,142 |
|
BlackRock Credit Allocation Income Trust I, Inc
|
|
|
628,100 |
|
|
|
623,661 |
|
| |
104,900 |
|
BlackRock Income Trust, Inc
|
|
|
609,177 |
|
|
|
709,124 |
|
| |
94,043 |
|
Cohen & Steers Dividend Majors Fund, Inc
|
|
|
1,043,289 |
|
|
|
931,966 |
|
| |
70,000 |
|
Cohen & Steers Infrastructure Fund, Inc
|
|
|
941,711 |
|
|
|
885,500 |
|
| |
152,014 |
|
Cohen & Steers Quality Income Realty Fund, Inc
|
|
|
587,993 |
|
|
|
962,249 |
|
| |
55,000 |
|
Cohen & Steers REIT and Preferred Income Fund, Inc
|
|
|
693,831 |
|
|
|
580,800 |
|
| |
325,000 |
|
DCA Total Return Fund
|
|
|
874,161 |
|
|
|
812,500 |
|
| |
150,000 |
|
DCW Total Return Fund
|
|
|
664,030 |
|
|
|
661,500 |
|
| |
54,000 |
|
Gabelli Dividend & Income Trust (a)
|
|
|
897,603 |
|
|
|
648,000 |
|
| |
55,623 |
|
Helios Advantage Income Fund, Inc
|
|
|
266,174 |
|
|
|
373,230 |
|
| |
42,000 |
|
John Hancock Bank and Thrift Opportunity Fund
|
|
|
631,158 |
|
|
|
602,280 |
|
| |
27,626 |
|
LMP Capital & Income Fund Inc.
|
|
|
275,672 |
|
|
|
264,933 |
|
| |
87,534 |
|
Macquarie/First Trust Global Infrastructure/Utilities Dividend
|
|
|
|
|
|
|
|
|
| |
|
|
& Income Fund
|
|
|
1,016,312 |
|
|
|
930,486 |
|
| |
60,589 |
|
Macquarie Global Infrastructure Total Return Fund Inc
|
|
|
987,450 |
|
|
|
796,745 |
|
| |
71,860 |
|
NFJ Dividend, Interest & Premium Strategy Fund
|
|
|
996,663 |
|
|
|
992,387 |
|
| |
31,700 |
|
Nuveen Diversified Dividend and Income Fund
|
|
|
319,016 |
|
|
|
312,562 |
|
| |
150,000 |
|
Nuveen Multi-Strategy Income and Growth Fund
|
|
|
739,668 |
|
|
|
1,101,000 |
|
| |
135,000 |
|
Nuveen Multi-Strategy Income and Growth Fund 2
|
|
|
904,050 |
|
|
|
1,050,300 |
|
| |
59,477 |
|
RMR Real Estate Fund
|
|
|
808,673 |
|
|
|
1,453,023 |
|
| |
|
|
|
|
|
|
|
|
|
|
|
| |
|
|
Total closed end funds
|
|
|
14,539,818 |
|
|
|
15,269,806 |
|
| |
|
|
|
|
|
|
|
|
|
|
|
|
Principal
Amount (b)
|
|
|
|
|
|
|
|
|
|
|
| |
|
|
DEBT SECURITIES (32.30%)
|
|
|
|
|
|
|
|
|
| |
|
|
Australia (2.76%)
|
|
|
|
|
|
|
|
|
| |
A$500,000 |
|
Telstra Corp. Ltd., 6.25% Senior Notes, due 4/15/15
|
|
|
365,869 |
|
|
|
420,873 |
|
| |
A$500,000 |
|
Telstra Corp. Ltd., 7.25% Senior Notes, due 11/15/12 (a)
|
|
|
402,672 |
|
|
|
438,673 |
|
| |
|
|
|
|
|
768,541 |
|
|
|
859,546 |
|
| |
|
|
Austria (4.02%)
|
|
|
|
|
|
|
|
|
| |
€1,000,000 |
|
Republic of Austria, 5.25% Euro Medium Term Notes, due 1/04/11 (a)
|
|
|
1,294,919 |
|
|
|
1,253,253 |
|
| |
|
|
|
|
|
|
|
|
|
|
|
| |
|
|
Canada (5.31%)
|
|
|
|
|
|
|
|
|
| |
C$500,000 |
|
Molson Coors Capital Finance, 5.00% Guaranteed Notes, due 9/22/15 (a)
|
|
|
446,496 |
|
|
|
499,901 |
|
| |
A$1,350,000 |
|
Province of Ontario, 5.50% Euro Medium Term Notes, due 7/13/12 (a)
|
|
|
1,035,273 |
|
|
|
1,155,251 |
|
| |
|
|
|
|
|
1,481,769 |
|
|
|
1,655,152 |
|
| |
|
|
Cyprus (2.02%)
|
|
|
|
|
|
|
|
|
| |
€500,000 |
|
Republic of Cyprus, 4.375% Euro Medium Term Notes, due 7/15/14
|
|
|
619,223 |
|
|
|
631,356 |
|
| |
|
|
|
|
|
|
|
|
|
|
|
| |
|
|
Germany (2.41%)
|
|
|
|
|
|
|
|
|
| |
£500,000 |
|
RWE Finance B.V., 4.625% Notes, due 8/17/10
|
|
|
922,608 |
|
|
|
750,547 |
|
See notes to financial statements.
SCHEDULE OF PORTFOLIO INVESTMENTS – (UNAUDITED) (CONTINUED)
| |
|
|
|
|
|
|
|
Principal
Amount (b)
|
|
|
|
Cost
|
|
|
Value
|
|
| |
|
|
|
|
|
|
|
|
| |
|
DEBT SECURITIES (continued)
|
|
|
|
|
|
|
| |
|
Hungary (1.96%)
|
|
|
|
|
|
|
| |
€500,000 |
|
Republic of Hungary, 4.00% Bonds, due 9/27/10
|
|
$ |
619,469 |
|
|
$ |
612,466 |
|
| |
|
|
|
|
|
|
|
|
|
|
|
| |
|
|
Mexico (3.53%)
|
|
|
|
|
|
|
|
|
| |
1,000,000 |
|
United Mexican States, 5.625% Notes, due 1/15/17 (a)
|
|
|
984,119 |
|
|
|
1,102,500 |
|
| |
|
|
|
|
|
|
|
|
|
|
|
| |
|
|
Netherlands (7.96%)
|
|
|
|
|
|
|
|
|
| |
€1,000,000 |
|
ING Bank N.V., 5.50% Euro Medium Term Notes, due 1/04/12
|
|
|
1,319,278 |
|
|
|
1,258,974 |
|
| |
€1,000,000 |
|
Rabobank Nederland, 3.125% Senior Notes, due 7/19/10
|
|
|
1,332,352 |
|
|
|
1,225,370 |
|
| |
|
|
|
|
|
2,651,630 |
|
|
|
2,484,344 |
|
| |
|
|
South Korea (1.72%)
|
|
|
|
|
|
|
|
|
| |
500,000 |
|
Korea Development Bank, 5.75% Notes, due 9/10/13 (a)
|
|
|
505,866 |
|
|
|
537,097 |
|
| |
|
|
|
|
|
|
|
|
|
|
|
| |
|
|
United States (0.61%)
|
|
|
|
|
|
|
|
|
| |
241,865 |
|
CIT RV Trust 1998-A B 6.29% Subordinated Bonds, due 1/15/17 (a)
|
|
|
246,040 |
|
|
|
190,503 |
|
| |
|
|
|
|
|
|
|
|
|
|
|
| |
|
|
Total debt securities
|
|
|
10,094,184 |
|
|
|
10,076,764 |
|
| |
|
|
|
|
|
|
|
|
|
|
|
| |
|
|
|
|
|
|
|
|
|
|
|
| |
|
|
CLOSED END FUND BUSINESS DEVELOPMENT
|
|
|
|
|
|
|
|
|
|
Shares
|
|
COMPANIES (11.04%)
|
|
|
|
|
|
|
|
|
| |
|
|
United States
|
|
|
|
|
|
|
|
|
| |
485,911 |
|
GSC Investment Corp
|
|
|
1,057,164 |
|
|
|
898,935 |
|
| |
67,393 |
|
Kohlberg Capital Corp
|
|
|
340,596 |
|
|
|
337,639 |
|
| |
101,500 |
|
MVC Capital, Inc
|
|
|
980,236 |
|
|
|
1,311,380 |
|
| |
124,897 |
|
NGP Capital Resources Co
|
|
|
881,008 |
|
|
|
895,512 |
|
| |
|
|
|
|
|
|
|
|
|
|
|
| |
|
|
Total closed end fund business development companies
|
|
|
3,259,004 |
|
|
|
3,443,466 |
|
| |
|
|
|
|
|
|
|
|
|
|
|
| |
|
|
PREFERRED STOCKS (2.21%)
|
|
|
|
|
|
|
|
|
| |
|
|
United States
|
|
|
|
|
|
|
|
|
| |
4,000 |
|
BAC Capital Trust II, 7.00%
|
|
|
100,000 |
|
|
|
89,760 |
|
| |
25,000 |
|
Corporate-Backed Trust Certificates, 8.20% (Motorola)
|
|
|
625,000 |
|
|
|
600,750 |
|
| |
|
|
|
|
|
|
|
|
|
|
|
| |
|
|
Total preferred stocks
|
|
|
725,000 |
|
|
|
690,510 |
|
See notes to financial statements.
SCHEDULE OF PORTFOLIO INVESTMENTS – (UNAUDITED) (CONCLUDED)
| |
|
|
|
|
|
|
|
Shares
|
|
|
|
Cost
|
|
|
Value
|
|
| |
|
MONEY MARKET FUND (11.06%)
|
|
|
|
|
|
|
| |
|
United States
|
|
|
|
|
|
|
| |
3,448,863 |
|
SSgA Money Market Fund, 0.01% (c)
|
|
$ |
3,448,863 |
|
|
$ |
3,448,863 |
|
| |
|
|
|
|
|
|
|
|
|
|
|
| |
|
|
Total investments (105.56%)
|
|
$ |
32,066,869 |
|
|
|
32,929,409 |
|
| |
|
|
|
|
|
|
|
|
|
|
|
| |
|
|
Liabilities in excess of other assets (-5.56%)
|
|
|
|
|
|
|
(1,735,449 |
) |
| |
|
|
|
|
|
|
|
|
|
|
|
| |
|
|
Net assets (100.00%)
|
|
|
|
|
|
$ |
31,193,960 |
|
| |
|
|
|
|
|
|
|
|
|
|
|
| |
|
|
|
|
|
|
|
|
|
|
|
| |
|
(a) |
Fully or partially pledged as collateral on bank credit facility. |
|
|
|
|
|
|
|
|
| |
|
|
|
|
|
|
|
|
|
|
|
| |
|
(b) |
The principal amount is stated in U.S. dollars unless otherwise indicated. |
|
|
|
|
|
|
|
|
| |
|
|
|
|
|
|
|
|
|
|
|
| |
|
|
Currency Symbols |
|
|
|
|
|
|
|
|
| |
|
|
A$
£
C$
€
|
Australian Dollar
British Pound
Canadian Dollar
Euro
|
|
|
|
|
|
|
|
|
| |
|
|
|
|
|
|
|
|
|
|
|
| |
|
(c) |
Rate represents the 7 day annualized yield at June 30, 2010. |
|
|
|
|
|
|
|
|
See notes to financial statements.
|
STATEMENT OF ASSETS AND LIABILITIES
|
|
STATEMENT OF OPERATIONS
|
|
|
|
|
June 30, 2010 (Unaudited)
|
|
|
|
Six Months Ended June 30, 2010 (Unaudited)
|
|
|
|
| |
|
|
|
|
|
|
|
|
ASSETS
|
|
|
|
INVESTMENT INCOME
|
|
|
|
|
Investments, at value (cost: $32,066,869)
|
|
$ |
32,929,409 |
|
Dividends
|
|
$ |
532,513 |
|
|
Cash
|
|
|
2,865 |
|
Interest
|
|
|
292,782 |
|
|
Receivables:
|
|
|
|
|
Total investment income
|
|
|
825,295 |
|
|
Interest
|
|
|
286,106 |
|
|
|
|
|
|
|
Dividends
|
|
|
191,664 |
|
EXPENSES
|
|
|
|
|
|
Other assets
|
|
|
5,319 |
|
Investment management
|
|
|
114,986 |
|
|
Total assets
|
|
|
33,415,363 |
|
Administrative services
|
|
|
45,925 |
|
| |
|
|
|
|
Legal
|
|
|
37,313 |
|
|
LIABILITIES
|
|
|
|
|
Bookkeeping and pricing
|
|
|
22,760 |
|
|
Payables:
|
|
|
|
|
Directors
|
|
|
14,202 |
|
|
Investments purchased
|
|
|
2,107,279 |
|
Auditing
|
|
|
10,815 |
|
|
Accrued expenses
|
|
|
78,061 |
|
Shareholder communications
|
|
|
10,431 |
|
|
Investment management
|
|
|
18,144 |
|
Interest and fees on bank credit facility
|
|
|
10,139 |
|
|
Administrative services
|
|
|
17,919 |
|
Insurance
|
|
|
5,430 |
|
|
Total liabilities
|
|
|
2,221,403 |
|
Custodian
|
|
|
5,110 |
|
| |
|
|
|
|
Transfer agent
|
|
|
4,515 |
|
|
NET ASSETS
|
|
$ |
31,193,960 |
|
Other
|
|
|
3,749 |
|
| |
|
|
|
|
Total expenses
|
|
|
285,375 |
|
|
NET ASSET VALUE PER SHARE
|
|
|
|
|
Net investment income
|
|
|
539,920 |
|
| |
|
|
|
|
|
|
|
|
|
|
(applicable to 7,410,506 shares
|
|
|
|
|
|
|
|
|
|
|
outstanding: 20,000,000 shares of $.01
|
|
|
|
|
REALIZED AND UNREALIZED GAIN (LOSS)
|
|
|
|
|
|
par value authorized)
|
|
$ |
4.21 |
|
Net realized gain (loss):
|
|
|
|
|
| |
|
|
|
|
|
|
|
|
|
| |
|
|
|
|
Investments
|
|
|
962,872 |
|
|
NET ASSETS CONSIST OF
|
|
|
|
|
Foreign currencies
|
|
|
116,928 |
|
|
Paid in capital
|
|
$ |
33,265,142 |
|
Short sales
|
|
|
(4,296 |
) |
|
Accumulated undistributed net investments
|
|
|
|
|
Net unrealized depreciation:
|
|
|
|
|
|
income
|
|
|
69,994 |
|
Investments
|
|
|
(1,112,862 |
) |
|
Accumulated net realized loss on
|
|
|
|
|
Translation of assets and liabilities
|
|
|
|
|
|
investments and foreign currencies
|
|
|
(2,982,998 |
) |
in foreign currencies
|
|
|
(1,312,960 |
) |
|
Net unrealized appreciation on
|
|
|
|
|
Net realized and unrealized loss
|
|
|
(1,350,318 |
) |
|
investments and foreign currencies
|
|
|
841,822 |
|
Net change in net assets
|
|
|
|
|
| |
|
|
|
|
|
|
|
|
|
| |
|
$ |
31,193,960 |
|
resulting from operations
|
|
$ |
(810,398 |
) |
| |
|
|
|
|
|
|
|
|
|
See notes to financial statements.
STATEMENTS OF CHANGES IN NET ASSETS
| |
|
Six Months
|
|
|
Year
|
|
| |
|
Ended
|
|
|
Ended
|
|
| |
|
June 30, 2010
|
|
|
December 31,
|
|
| |
|
(Unaudited)
|
|
|
2009
|
|
| OPERATIONS |
|
|
|
|
|
|
|
|
|
Net investment income
|
|
$ |
539,920 |
|
|
$ |
1,519,973 |
|
|
Net realized gain (loss)
|
|
|
1,075,504 |
|
|
|
(1,542,455 |
) |
|
Unrealized appreciation (depreciation)
|
|
|
(2,425,822 |
) |
|
|
7,581,905 |
|
| |
|
|
|
|
|
|
|
|
|
Net increase (decrease) in net assets resulting from operations
|
|
|
(810,398 |
) |
|
|
7,559,423 |
|
| |
|
|
|
|
|
|
|
|
|
DISTRIBUTIONS TO SHAREHOLDERS
|
|
|
|
|
|
|
|
|
|
Distributions from ordinary income ($0.11 and $0.235 per share, respectively)
|
|
|
(815,022 |
) |
|
|
(1,740,436 |
) |
| |
|
|
|
|
|
|
|
|
|
CAPITAL SHARE TRANSACTIONS
|
|
|
|
|
|
|
|
|
|
Reinvestment of distributions to shareholders (1,623 and 5,006 shares, respectively)
|
|
|
5,889 |
|
|
|
15,554 |
|
| |
|
|
|
|
|
|
|
|
|
Total change in net assets
|
|
|
(1,619,531 |
) |
|
|
5,834,541 |
|
| |
|
|
|
|
|
|
|
|
|
NET ASSETS
|
|
|
|
|
|
|
|
|
|
Beginning of period
|
|
|
32,813,491 |
|
|
|
26,978,950 |
|
| |
|
|
|
|
|
|
|
|
|
End of period
|
|
$ |
31,193,960 |
|
|
$ |
32,813,491 |
|
| |
|
|
|
|
|
|
|
|
|
End of period net assets include undistributed net investment income
|
|
$ |
69,994 |
|
|
$ |
345,096 |
|
See notes to financial statements.
|
STATEMENT OF CASH FLOWS
|
|
|
|
|
Six Months Ended June 30, 2010 (Unaudited)
|
|
|
|
| |
|
|
|
|
CASH FLOWS FROM OPERATING ACTIVITIES
|
|
|
|
|
Net decrease in net assets resulting from operations
|
|
$ |
(810,398 |
) |
|
Adjustments to reconcile change in net assets resulting from
|
|
|
|
|
|
operations to net cash provided by (used in) operating activities:
|
|
|
|
|
|
Proceeds from sales of long term investments
|
|
|
11,877,009 |
|
|
Purchase of long term investments
|
|
|
(9,343,768 |
) |
|
Net purchases of short term investments
|
|
|
(3,506,492 |
) |
|
Unrealized depreciation of investments and foreign currencies
|
|
|
2,399,917 |
|
|
Net realized gain on sales of investments, short sales and
|
|
|
|
|
|
foreign currencies
|
|
|
(1,075,504 |
) |
|
Buy to cover investments held short
|
|
|
(485,000 |
) |
|
Proceeds from securities sold short
|
|
|
480,704 |
|
|
Amortization of premium net of accretion of discount of investments
|
|
|
36,165 |
|
|
Decrease in interest receivable
|
|
|
99,456 |
|
|
Increase in dividends receivable
|
|
|
(97,229 |
) |
|
Decrease in other assets
|
|
|
5,430 |
|
|
Increase in payable for investments purchased
|
|
|
2,107,279 |
|
|
Increase in accrued expenses
|
|
|
15,239 |
|
|
Decrease in investment management fee payable
|
|
|
(1,071 |
) |
|
Increase in administrative services payable
|
|
|
8,569 |
|
| |
|
|
|
|
|
Net cash provided by operating activities
|
|
|
1,710,306 |
|
| |
|
|
|
|
|
CASH FLOWS FROM FINANCING ACTIVITIES
|
|
|
|
|
|
Repayment of bank line of credit
|
|
|
(898,308 |
) |
|
Cash distributions paid
|
|
|
(809,133 |
) |
| |
|
|
|
|
|
Net cash used in financing activities
|
|
|
(1,707,441 |
) |
| |
|
|
|
|
|
Net change in cash
|
|
|
2,865 |
|
| |
|
|
|
|
|
CASH
|
|
|
|
|
|
Beginning of period
|
|
|
– |
|
|
End of period
|
|
$ |
2,865 |
|
| |
|
|
|
|
|
SUPPLEMENTAL DISCLOSURE OF CASH FLOW INFORMATION
|
|
|
|
|
|
Cash paid for interest and fees on bank credit facility
|
|
$ |
9,602 |
|
|
Non-cash financing activities not included herein consisted
|
|
|
|
|
|
of reinvestment of distributions
|
|
$ |
5,889 |
|
See notes to financial statements.
NOTES TO FINANCIAL STATEMENTS - JUNE 30, 2010 (UNAUDITED)
1. Organization and Significant Accounting Policies
Global Income Fund, Inc., a Maryland corporation registered under the Investment Company Act of 1940, as amended (the “Act”), is a non-diversified, closed end management investment company, whose shares are quoted over the counter under the ticker symbol GIFD. The Fund’s investment objectives are primarily to provide a high level of income and, secondarily, capital appreciation. The Fund retains CEF Advisers, Inc. as its Investment Manager.
The following is a summary of the Fund’s significant accounting policies.
Security Valuation – Portfolio securities are valued by various methods depending on the primary market or exchange on which they trade. Most equity securities for which the primary market is the United States are valued at the official closing price, last sale price or, if no sale has occurred, at the closing bid price. Most equity securities for which the primary market is outside the United States are valued using the official closing price or the last sale price in the principal market in which they are traded. If the last sale price (on the local exchange) is unavailable, the last evaluated quote or closing bid price normally is used. Certain of the securities in which the Fund invests are priced through pricing services that may utilize a matrix pricing system which takes into consideration factors such as yields, prices, maturities, call features, and ratings on comparable securities. Bonds may be valued according to prices quoted by a bond dealer that offers pricing services. Open end investment companies are valued at their net asset value. Securities for which quotations are not readily available or reliable and other assets may be valued as determined in good faith by the Investment Manager under the direction of or pursuant to procedures established by the Fund’s Board of Directors. Due to the inherent uncertainty of valuation, these values may differ from the values that would have been used had a readily available market for the securities existed. These differences in valuation could be material. A security’s valuation may differ depending on the method used for determining value. The use of fair value pricing by the Fund may cause the net asset value of its shares to differ from the net asset value that would be calculated using market prices.
Foreign Currency Translation – Securities denominated in foreign currencies are translated into U.S. dollars at prevailing exchange rates. Realized gain or loss on sales of such investments in local currency terms is reported separately from gain or loss attributable to a change in foreign exchange rates for those investments.
Foreign Currency Contracts – Forward foreign currency contracts are marked to market and the change in market value is recorded by the Fund as an unrealized gain or loss. When a contract is closed, the Fund records a realized gain or loss equal to the difference between the value of the contract at the time it was opened and the value at the time it was closed. The Fund could be exposed to risk if the counterparties are unable to meet the terms of the contracts or if the value of the currency changes unfavorably.
Investments in Other Investment Companies – The Fund may invest in shares of other investment companies (or entities that would be considered investment companies but are excluded from the definition pursuant to certain exceptions under the Act) (the “Acquired Funds”) in accordance with the Act and related rules. Shareholders in the Fund bear the pro rata portion of the fees and expenses of the Acquired Funds in addition to the Fund’s expenses. Expenses incurred by the Fund that are disclosed in the Statement of Operations do not include fees and expenses incurred by the Acquired Funds. The fees and expenses of the Acquired Funds are included in the Fund’s total returns.
Short Sales – The Fund may sell a security it does not own in anticipation of a decline in the value of the security. When the Fund sells a security short, it must borrow the security sold short and deliver it to the broker/dealer through which it made the short sale. The Fund is liable for any dividends or interest paid on securities sold short. A gain, limited to the price at which the Fund sold the security short, or a loss, unlimited in size, will be recognized upon the termination of a short sale. Securities sold short result in off balance sheet risk as the Fund’s ultimate obligation to satisfy the terms of the sale of securities sold short may exceed the amount recognized in the Statement of Assets and Liabilities.
NOTES TO FINANCIAL STATEMENTS - (UNAUDITED) (CONTINUED)
Investment Transactions – Investment transactions are accounted for on the trade date (the date the order to buy or sell is executed). Realized gains or losses are determined by specifically identifying the cost basis of the investment sold.
Investment Income – Interest income is recorded on the accrual basis. Amortization of premium and accretion of discount on debt securities are included in interest income. Dividend income is recorded on the ex-dividend date. Taxes withheld on foreign dividends have been provided for in accordance with the Fund’s understanding of the applicable country’s tax rules and rates.
Expenses – Estimated expenses are accrued daily. Expenses directly attributable to the Fund are charged to the Fund. Expenses borne by the complex of related investment companies, which includes open end and closed end investment companies for which the Investment Manager and its affiliate serve as investment manager, that are not directly attributed to the Fund are allocated among the Fund and the other investment companies in the complex on the basis of relative net assets, except where a more appropriate allocation of expenses can be made fairly.
Expense Reduction Arrangement – Through arrangements with the Fund’s custodian and cash management bank, credits realized as a result of uninvested cash balances are used to reduce custodian expenses. No credits were realized by the Fund during the period.
Distributions to Shareholders – Distributions to shareholders, which are determined in accordance with income tax regulations, are recorded on the ex-dividend date.
Income Taxes – No provision has been made for U.S. income taxes because the Fund’s current intention is to continue to qualify as a regulated investment company under the Internal Revenue Code and to distribute to its shareholders substantially all of its taxable income and net realized gains. Foreign securities held by the Fund may be subject to foreign taxation. Foreign taxes, if any, are recorded based on the tax regulations and rates that exist in the foreign markets in which the Fund invests. The Fund recognizes the tax benefits of uncertain tax positions only where the position is “more likely than not” to be sustained assuming examination by tax authorities. The Fund has reviewed its tax positions and has concluded that no liability for unrecognized tax benefits should be recorded related to uncertain tax positions taken on federal, state, and local income tax returns for open tax years (2007 – 2009), or expected to be taken in the Fund’s 2010 tax returns.
Use of Estimates – In preparing financial statements in conformity with accounting principles generally accepted in the United States of America (“GAAP”), management makes estimates and assumptions that affect the reported amounts of assets and liabilities as of the date of the financial statements, as well as the reported amounts of revenues and expenses during the reporting period. Actual results could differ from those estimates.
Indemnifications – The Fund indemnifies its officers and directors from certain liabilities that might arise from their performance of their duties for the Fund. Additionally, in the normal course of business, the Fund enters into contracts that contain a variety of representations and warranties and which may provide general indemnifications. The Fund’s maximum exposure under these arrangements is unknown as it involves future claims that may be made against the Fund under circumstances that have not occurred.
Recently Issued Accounting Standards Updates – In January 2010, the Financial Accounting Standard Board released Accounting Standards Update (“ASU”) No. 2010-06, Improving Disclosures about Fair Value Measurements. Among the new disclosures and clarifications of existing disclosures the ASU requires the Fund to disclose separately the amounts of significant transfers in and out of Level 1 and Level 2 fair value measurements and to describe the reasons for the transfers. Significance shall be judged with respect to total earnings and total assets or total liabilities. The ASU requires the Level 3 roll forward reconciliation of beginning and ending balances to be prepared on a gross basis, in particular separately presenting information about pur- chases, sales, issuances, and settlements. The ASU also requires disclosure of the reasons for significant transfers in and out of Level 3. The Fund adopted the ASU on January 1, 2010, except for the Level 3 gross basis roll forward reconciliation which is effective for fiscal years beginning after December 15, 2010 and for interim periods within those fiscal years.
NOTES TO FINANCIAL STATEMENTS - (UNAUDITED) (CONTINUED)
2. Fees and Transactions with Related Parties
The Fund retains the Investment Manager pursuant to an Investment Management Agreement (“IMA”). Under the terms of the IMA, the Investment Manager receives a management fee, payable monthly, based on the average daily net assets of the Fund at an annual rate of 7/10 of 1% of the first $50 million, 5/8 of 1% over $50 million to $150 million, and 1/2 of 1% over $150 million. Certain officers and directors of the Fund are officers and directors of the Investment Manager. Pursuant to the IMA, the Fund reimburses the Investment Manager for providing at cost certain administrative services comprised of compliance and accounting services. For the six months ended June 30, 2010, the Fund incurred total administrative costs of $45,925, comprised of $31,455 and $14,470 for compliance and accounting services, respectively.
3. Distributions to Shareholders and Distributable Earnings
The Fund paid distributions totaling $815,022 for the six months ended June 30, 2010. The majority and possibly all of the 2010 distribution may be comprised of net investment income. This is only an estimate based on information available at this time and is subject to change. Actual amounts may be recharacterized between net investment income and return of capital for tax purposes after year end 2010, although the exact amount for the full 2010 year is not estimable at June 30, 2010.
The tax character of distributions paid to shareholders for the year ended December 31, 2009 in the amount of $1,740,436 was comprised of ordinary income.
As of December 31, 2009, the components of distributable earnings on a tax basis were as follows:
|
Undistributed net investment income
|
|
$ |
345,096 |
|
|
Unrealized appreciation on investments and foreign currencies
|
|
|
3,267,160 |
|
|
Capital loss carryovers
|
|
|
(3,227,408 |
) |
|
Post-October losses
|
|
|
(830,609 |
) |
| |
|
$ |
(445,761 |
) |
Federal income tax regulations permit post-October net capital losses to be deferred and recognized on the tax return of the next succeeding taxable year.
GAAP requires certain components of net assets to be reclassified between financial and tax reporting. These reclassifications have no effect on net assets or net asset value per share. For the year ended December 31, 2009, permanent differences between book and tax accounting have been reclassified as follows:
|
Increase in
|
|
|
Increase in
|
|
|
|
|
|
Increase in
|
|
|
Undistributed
|
|
|
Net Realized Loss on
|
|
|
Increase in
|
|
|
Unrealized
|
|
|
Net Investment Income
|
|
|
Investments and Foreign Currencies
|
|
|
Paid in Capital
|
|
|
Appreciation
|
|
| $ |
41,569 |
|
|
$ |
(110,477 |
) |
|
$ |
12,706 |
|
|
$ |
56,202 |
|
As of December 31, 2009, the Fund had net capital loss carryovers of $3,227,408, of which $1,369,211, $252,390, and $1,605,807 expire in 2010, 2014, and 2,017, respectively, that may be used to offset future realized capital gains for federal income tax purposes.
NOTES TO FINANCIAL STATEMENTS - (UNAUDITED) (CONTINUED)
4. Fair Value Measurements
The Fund uses a three level hierarchy for fair value measurements based on the transparency of inputs to the valuation of an asset or liability. Inputs may be observable or unobservable and refer broadly to the assumptions that market participants would use in pricing the asset or liability. Observable inputs reflect the assumptions market participants would use in pricing the asset or liability based on market data obtained from sources independent of the Fund. Unobservable inputs reflect the Fund’s own assumptions about the assumptions that market participants would use in pricing the asset or liability developed based on the best information available under the circumstances. The Fund’s investment in its entirety is assigned a level based upon the inputs which are significant to the overall valuation. The hierarchy of inputs is summarized below.
| Level 1 |
- quoted prices in active markets for identical investments. |
| Level 2 |
- other significant observable inputs (including quoted prices for similar investments, interest rates, prepayment speeds, credit risk, etc.). |
| Level 3 |
- significant unobservable inputs (including the Fund’s own assumptions in determining fair value of investments). |
The inputs or methodology used for valuing investments are not an indication of the risk associated with investing in those securities.
The following is a summary of the inputs used as of June 30, 2010 in valuing the Fund’s assets carried at fair value. Refer to the Schedule of Portfolio Investments for detailed information on specific investments.
| |
|
Level 1
|
|
|
Level 2
|
|
|
Level 3
|
|
|
Total
|
|
|
Assets
|
|
|
|
|
|
|
|
|
|
|
|
|
|
Closed end funds
|
|
|
|
|
|
|
|
|
|
|
|
|
|
United States
|
|
$ |
15,269,806 |
|
|
$ |
-- |
|
|
$ |
-- |
|
|
$ |
15,269,806 |
|
|
Debt securities
|
|
|
|
|
|
|
|
|
|
|
|
|
|
|
|
|
|
Australia
|
|
|
-- |
|
|
|
859,546 |
|
|
|
-- |
|
|
|
859,546 |
|
|
Austria
|
|
|
-- |
|
|
|
1,253,253 |
|
|
|
-- |
|
|
|
1,253,253 |
|
|
Canada
|
|
|
-- |
|
|
|
1,655,152 |
|
|
|
-- |
|
|
|
1,655,152 |
|
|
Cyprus
|
|
|
-- |
|
|
|
631,356 |
|
|
|
-- |
|
|
|
631,356 |
|
|
Germany
|
|
|
-- |
|
|
|
750,547 |
|
|
|
-- |
|
|
|
750,547 |
|
|
Hungary
|
|
|
-- |
|
|
|
612,466 |
|
|
|
-- |
|
|
|
612,466 |
|
|
Mexico
|
|
|
-- |
|
|
|
1,102,500 |
|
|
|
-- |
|
|
|
1,102,500 |
|
|
Netherlands
|
|
|
-- |
|
|
|
2,484,344 |
|
|
|
-- |
|
|
|
2,484,344 |
|
|
South Korea
|
|
|
-- |
|
|
|
537,097 |
|
|
|
-- |
|
|
|
537,097 |
|
|
United States
|
|
|
-- |
|
|
|
190,503 |
|
|
|
-- |
|
|
|
190,503 |
|
|
Closed end fund business development companies
|
|
|
|
|
|
|
|
|
|
|
|
|
|
|
|
|
|
United States
|
|
|
3,443,466 |
|
|
|
-- |
|
|
|
-- |
|
|
|
3,443,466 |
|
|
Preferred stocks
|
|
|
|
|
|
|
|
|
|
|
|
|
|
|
|
|
|
United States
|
|
|
690,510 |
|
|
|
-- |
|
|
|
-- |
|
|
|
690,510 |
|
|
Money market fund
|
|
|
|
|
|
|
|
|
|
|
|
|
|
|
|
|
|
United States
|
|
|
3,448,863 |
|
|
|
-- |
|
|
|
-- |
|
|
|
3,448,863 |
|
| |
|
|
|
|
|
|
|
|
|
|
|
|
|
|
|
|
|
Total investments
|
|
$ |
22,852,645 |
|
|
$ |
10,076,764 |
|
|
$ |
-- |
|
|
$ |
32,929,409 |
|
There were no transfers between Level 1 and Level 2 during the six months ended June 30, 2010.
NOTES TO FINANCIAL STATEMENTS - (UNAUDITED) (CONTINUED)
5. Securities Transactions
Purchases and sales/repayments/maturities of securities, excluding short sale transactions and short term investments, aggregated $9,343,768 and $11,877,009, respectively, for the six months ended June 30, 2010. At June 30, 2010, for federal income tax purposes, the aggregate cost of securities was $32,066,869 and net unrealized appreciation was $862,540, comprised of gross unrealized appreciation of $2,504,969 and gross unrealized depreciation of $1,642,429.
6. Bank Credit Facility
The Fund, Foxby Corp., Midas Fund, Inc., and Midas Special Fund, Inc. (the “Borrowers”) have entered into a committed secured line of credit facility, which is subject to annual renewal, with State Street Bank and Trust Company (“SSB”), the Fund’s custodian. Foxby Corp. is a closed end investment company managed by the Investment Manager, and Midas Fund, Inc. and Midas Special Fund, Inc. are open end investment companies managed by an affiliate of the Investment Manager. The aggregate amount of the credit facility is $10,000,000. The borrowing of each Borrower is collateralized by the underlying investments of such Borrower. SSB will make revolving loans to a Borrower not to exceed in the aggregate outstanding at any time with respect to any one Borrower the least of $10,000,000, the maximum amount permitted pursuant to each Borrower’s investment policies, or as permitted under the Act. The commitment fee on this facility is 0.15% per annum on the unused portion of the commitment, based on a 360 day year. All loans under this facility will be available at the Borrower’s option of (i) overnight Federal funds or (ii) LIBOR (30, 60, 90 days), each as in effect from time to time, plus 1.50% per annum, calculated on the basis of actual days elapsed for a 360 day year. At June 30, 2010, there were investment securities pledged as collateral with a value of $4,775,244 and no outstanding borrowings under the credit facility. For the six months ended June 30, 2010, the Fund’s weighted average interest rate under the credit facility was 1.92% based on its balances outstanding during the period and the Fund’s average daily amount outstanding during the period was $425,321.
7. Foreign Securities Risk
Investing in securities of foreign issuers involves special risks, including changes in foreign exchange rates and the possibility of future adverse political and economic developments, which could adversely affect the value of such securities. Moreover, securities in foreign issuers and markets may be less liquid and their prices more volatile than those of U.S. issuers and markets.
8. Capital Stock
At June 30, 2010, there were 7,410,506 shares of $.01 par value common stock outstanding (20,000,000 shares authorized). The shares issued and resulting increase in paid in capital in connection with reinvestment of distributions for the six months ended June 30, 2010 and the year ended December 31, 2009 were as follows:
| |
|
2010
|
|
|
2009
|
|
|
Shares issued
|
|
|
1,623 |
|
|
|
5,006 |
|
|
Increase in paid in capital
|
|
$ |
5,889 |
|
|
$ |
15,554 |
|
9. Share Repurchase Program
In accordance with Section 23(c) of the Act, the Fund may from time to time repurchase its shares in the open market at the discretion of the Board of Directors and upon such terms as the Directors shall determine. During the six months ended June 30, 2010 and the year ended December 31, 2009, the Fund did not repurchase any of its shares.
10. Other Information
The Fund may at times raise cash for investment by issuing shares through one or more offerings, including rights offerings. Proceeds from any such offerings will be invested in accordance with the investment objectives and policies of the Fund.
11. Subsequent Events
The Fund has evaluated subsequent events through the date the financial statements were issued and determined that no subsequent events have occurred that require additional disclosure in the financial statements.
FINANCIAL HIGHLIGHTS
| |
|
Six Months
|
|
|
|
|
|
|
|
|
|
|
|
|
|
|
|
|
| |
|
Ended June 30,
|
|
|
|
|
|
|
|
|
|
|
|
|
|
|
|
|
| |
|
2010
|
|
|
Year Ended December 31, |
|
| |
|
(Unaudited)
|
|
|
2009
|
|
|
2008
|
|
|
2007
|
|
|
2006
|
|
|
2005
|
|
| |
|
|
|
|
|
|
|
|
|
|
|
|
|
|
|
|
|
|
|
Per Share Operating Performance
|
|
|
|
|
|
|
|
|
|
|
|
|
|
|
|
|
|
|
|
(for a share outstanding throughout each period)
|
|
|
|
|
|
|
|
|
|
|
|
|
|
|
|
|
|
|
|
Net asset value, beginning of period
|
|
$ |
4.43 |
|
|
$ |
3.64 |
|
|
$ |
4.60 |
|
|
$ |
4.38 |
|
|
$ |
4.33 |
|
|
$ |
4.97 |
|
|
Income from investment operations:
|
|
|
|
|
|
|
|
|
|
|
|
|
|
|
|
|
|
|
|
|
|
|
|
|
|
Net investment income(1)
|
|
|
.07 |
|
|
|
.21 |
|
|
|
.19 |
|
|
|
.13 |
|
|
|
.13 |
|
|
|
.11 |
|
|
Net realized and unrealized gain (loss) on investments
|
|
|
(.18 |
) |
|
|
.82 |
|
|
|
(.91 |
) |
|
|
.31 |
|
|
|
.20 |
|
|
|
(.47 |
) |
| |
|
|
|
|
|
|
|
|
|
|
|
|
|
|
|
|
|
|
|
|
|
|
|
|
|
Total income from investment operations
|
|
|
(.11 |
) |
|
|
1.03 |
|
|
|
(.72 |
) |
|
|
.44 |
|
|
|
.33 |
|
|
|
(.36 |
) |
| |
|
|
|
|
|
|
|
|
|
|
|
|
|
|
|
|
|
|
|
|
|
|
|
|
|
Less distributions:
|
|
|
|
|
|
|
|
|
|
|
|
|
|
|
|
|
|
|
|
|
|
|
|
|
|
Net investment income
|
|
|
(.11 |
) |
|
|
(.24 |
) |
|
|
(.24 |
) |
|
|
(.17 |
) |
|
|
(.13 |
) |
|
|
(.20 |
) |
|
Return of capital
|
|
|
– |
|
|
|
– |
|
|
|
– |
|
|
|
(.05 |
) |
|
|
(.15 |
) |
|
|
(.08 |
) |
|
Total distributions
|
|
|
(.11 |
) |
|
|
(.24 |
) |
|
|
(.24 |
) |
|
|
(.22 |
) |
|
|
(.28 |
) |
|
|
(.28 |
) |
| |
|
|
|
|
|
|
|
|
|
|
|
|
|
|
|
|
|
|
|
|
|
|
|
|
|
Net asset value, end of period
|
|
$ |
4.21 |
|
|
$ |
4.43 |
|
|
$ |
3.64 |
|
|
$ |
4.60 |
|
|
$ |
4.38 |
|
|
$ |
4.33 |
|
| |
|
|
|
|
|
|
|
|
|
|
|
|
|
|
|
|
|
|
|
|
|
|
|
|
|
Market value, end of period
|
|
$ |
3.43 |
|
|
$ |
3.65 |
|
|
$ |
2.70 |
|
|
$ |
3.90 |
|
|
$ |
4.18 |
|
|
$ |
3.95 |
|
| |
|
|
|
|
|
|
|
|
|
|
|
|
|
|
|
|
|
|
|
|
|
|
|
|
|
Total Return(2)
|
|
|
|
|
|
|
|
|
|
|
|
|
|
|
|
|
|
|
|
|
|
|
|
|
|
Based on net asset value
|
|
|
(2.06 |
)% |
|
|
31.03 |
% |
|
|
(14.94 |
)% |
|
|
11.00 |
% |
|
|
8.43 |
% |
|
|
(6.95 |
)% |
| |
|
|
|
|
|
|
|
|
|
|
|
|
|
|
|
|
|
|
|
|
|
|
|
|
|
Based on market price
|
|
|
(3.15 |
)% |
|
|
45.55 |
% |
|
|
(25.58 |
)% |
|
|
(1.39 |
)% |
|
|
13.43 |
% |
|
|
(12.47 |
)% |
| |
|
|
|
|
|
|
|
|
|
|
|
|
|
|
|
|
|
|
|
|
|
|
|
|
|
Ratios/Supplemental Data
|
|
|
|
|
|
|
|
|
|
|
|
|
|
|
|
|
|
|
|
|
|
|
|
|
|
Net assets, end of period (000’s omitted)
|
|
$ |
31,194 |
|
|
$ |
32,813 |
|
|
$ |
26,979 |
|
|
$ |
34,057 |
|
|
$ |
32,362 |
|
|
$ |
31,975 |
|
|
Ratio of total expenses to average net assets
|
|
|
1.72 |
%(3)(4) |
|
|
1.62 |
%(3) |
|
|
1.68 |
%(3) |
|
|
1.77 |
% |
|
|
1.89 |
% |
|
|
1.59 |
% |
|
Ratio of net expenses to average net assets
|
|
|
1.72 |
%(3)(4) |
|
|
1.62 |
%(3) |
|
|
1.68 |
%(3) |
|
|
1.77 |
% |
|
|
1.89 |
% |
|
|
1.59 |
% |
|
Ratio of net expenses excluding loan
|
|
|
|
|
|
|
|
|
|
|
|
|
|
|
|
|
|
|
|
|
|
|
|
|
|
interest and fees to average net assets
|
|
|
1.66 |
%(3)(4) |
|
|
1.56 |
%(3) |
|
|
1.66 |
%(3) |
|
|
1.75 |
% |
|
|
1.87 |
% |
|
|
1.58 |
% |
|
Ratio of net investment income to
|
|
|
|
|
|
|
|
|
|
|
|
|
|
|
|
|
|
|
|
|
|
|
|
|
|
average net assets
|
|
|
3.26 |
%(3)(4) |
|
|
5.23 |
%(3) |
|
|
4.31 |
%(3) |
|
|
2.91 |
% |
|
|
2.71 |
% |
|
|
2.44 |
% |
|
Portfolio turnover rate
|
|
|
31 |
% |
|
|
48 |
% |
|
|
21 |
% |
|
|
10 |
% |
|
|
17 |
% |
|
|
32 |
% |
(1) The per share amounts were calculated using the average number of common shares outstanding during the period.
(2) Total return on a market value basis is calculated assuming a purchase of common stock on the opening of the first day and a sale on the closing of the last day of each period reported. Dividends and distributions, if any, are assumed for purposes of this calculation to be reinvested at prices obtained under the Fund’s Dividend Reinvestment Plan. Generally, total return on a net asset value basis will be higher than total return on a market value basis in periods where there is an increase in the discount or a decrease in the premium of the market value to the net asset value from the beginning to the end of such periods. Conversely, total return on a net asset value basis will be lower than total return on a market value basis in periods where there is a decrease in the discount or an increase in the premium of the market value to the net asset value from the beginning to the end of such periods. Total return calculated for a period of less than one year is not annualized. The calculation does not reflect brokerage commissions, if any.
(3) Does not include expenses incurred by the Acquired Funds in which the Fund invests.
(4) Annualized.
See notes to financial statements.
| The additional information below and on the following pages is supplemental and not part of the financial statements of the Fund. |
BOARD OF DIRECTORS’ ANNUAL APPROVAL OF THE INVESTMENT MANAGEMENT AGREEMENT
The investment management agreement (the “Agreement”) between Global Income Fund, Inc. and the investment manager, CEF Advisers, Inc., generally provides that the Agreement shall continue automatically for successive periods of twelve months each, provided that such continuance is specifically approved at least annually (i) by a vote of a majority of the Directors of the Fund who are not parties to the Agreement, or interested persons of any such party and (ii) by the Board of Directors of the Fund or by the vote of the holders of a majority of the outstanding voting securities of the Fund.
In considering the annual approval of the Agreement, the Board of Directors considered information that had been provided throughout the year at regular Board meetings, as well as information furnished to the Board for the meeting held in March 2010 to specifically consider the continuance of the Agreement. Such information included, among other things, the following: information comparing the management fee of the Fund with those of comparable funds; information regarding Fund investment performance in comparison to a relevant peer group of funds; the economic outlook and the general investment outlook in relevant investment markets; the investment manager’s results and financial condition and the overall organization of the investment manager; the allocation of brokerage and the benefits received by the investment manager as a result of brokerage allocation; the investment manager’s trading practices, including soft dollars; the investment manager’s management of relationships with the custodian, transfer agent, pricing agent, brokers, and other service providers; the resources devoted to the investment manager’s compliance efforts undertaken on behalf of the funds it manages and the record of compliance with the investment policies and restrictions and with policies on personal securities transactions; the quality, nature, cost, and character of the administrative and other non-investment management services provided by the investment manager and its affiliates; the terms of the Agreement; the investment manager’s gifts and entertainment log; and the reasonableness and appropriateness of the particular fee paid by the Fund for the services described therein. The Board concluded that the investment manager is using soft dollars for the benefit of the Fund and its shareholders. The directors further concluded that the investment manager is using the Fund’s assets for the benefit of the Fund and its shareholders and is operating in the best interests of the Fund.
The Board of Directors also considered the nature, extent, and quality of the management services provided by the investment manager. In so doing, the Board considered the investment manager’s management capabilities with respect to the types of investments held by the Fund, including information relating to the education, experience, and number of investment professionals and other personnel who provide services under the Agreement. The Board also took into account the time and attention to be devoted by management to the Fund. The Board evaluated the level of skill required to manage the Fund and concluded that the human resources available at the investment manager were appropriate to fulfill effectively its duties on behalf of the Fund. The directors also noted that the investment manager has managed the Fund for several years and indicated their belief that a long term relationship with a capable, conscientious investment manager is in the best interests of the Fund.
The Board received information concerning the investment philosophy and investment process applied by the investment manager in managing the Fund. In this regard, the Board considered the investment manager’s in house research capabilities as well as other resources available to the investment manager personnel, including research services that may be available to the investment manager as a result of securities transactions effected for the Fund. The Board concluded that the investment manager’s investment process, research capabilities, and philosophy were well suited to the Fund, given the Fund’s investment objective and policies.
In its review of comparative information with respect to Fund investment performance, the Board received comparative information, comparing the Fund’s performance to that of others. After reviewing this information, the Board concluded that the Fund has performed within a range that the Board deemed competitive. With respect to its review of the investment management fee, the Board considered information comparing the Fund’s management fee and expense ratio to those of comparable funds. The Board noted that economies of scale may develop for the Fund as its assets increase and fund level expenses decline as a percentage of assets, but that fund level economies of scale may not necessarily result in investment manager level economies of scale. This information assisted the Board in concluding that the fee paid by the Fund is within the range of those paid by comparable funds within the closed end fund industry.
In reviewing the information regarding the expense ratio of the Fund, the Board concluded that although the Fund’s expense ratio is within a higher range, excluding extraordinary expenses, it is competitive with comparable funds in light of the quality of services received and assets managed.
In addition to the factors mentioned above, the Board reviewed the level of the investment manager’s profits in providing investment management and related services for the Fund. The Board considered the fiduciary duty assumed by the investment manager in connection with the services rendered to the Fund and the business reputation of the investment manager and its financial resources. The Board also considered information regarding the character and amount of other incidental benefits received by the investment manager and its affiliates from their association with the Fund. The Board concluded that potential “fall out” benefits that the investment manager and its affiliates may receive, such as greater name recognition, affiliated brokerage commissions, or increased ability to obtain research services, appear to be reasonable, and may, in some cases, benefit the Fund. The Board concluded that in light of the services rendered the profits realized by the investment manager are not unreasonable.
The Board did not consider any single factor as controlling in determining whether or not to renew the Agreement. In assessing the information provided by the investment manager and its affiliates, the Board also noted that it was taking into consideration the benefits to shareholders of investing in a fund that is part of an investment company complex.
Based on its consideration of the foregoing factors and conclusions, and such other factors and conclusions as it deemed relevant, and assisted by counsel, the Board concluded that the approval of the Agreement, including the fee structure, is in the best interests of the Fund.
INVESTMENT OBJECTIVES AND POLICIES
The Fund’s primary investment objective of providing a high level of income is fundamental and may not be changed without shareholder approval. The Fund is also subject to certain investment restrictions, set forth in its most recently effective Statement of Additional Information, that are fundamental and cannot be changed without shareholder approval. The Fund’s secondary investment objective of capital appreciation and the other investment policies described herein, unless otherwise stated, are not fundamental and may be changed by the Board of Directors without shareholder approval. Notice to shareholders of any change in the Fund’s secondary investment objective will be provided as required by law.
PROXY VOTING
The Fund’s Proxy Voting Guidelines, as well as its voting record for the most recent 12 months ended June 30, are available without charge by calling the Fund collect at 1-212-344-6310, on the SEC’s website at www.sec.gov, and on the Fund’s website at www.globalincomefund.net.
QUARTERLY SCHEDULE OF PORTFOLIO HOLDINGS
The Fund files its complete schedule of portfolio holdings with the SEC for the first and third quarters of each fiscal year on Form N-Q. The Fund’s Forms N-Q are available on the SEC’s website at www.sec.gov. The Fund’s Forms N-Q may be reviewed and copied at the SEC’s Public Reference Room in Washington, DC, and information on the operation of the Public Reference Room may be obtained by calling 1-800-SEC-0330. The Fund makes the Forms N-Q available on its website at www.globalincomefund.net.
GLOBALINCOMEFUND.NET
Visit us on the web at www.globalincomefund.net. The site provides information about the Fund, including market performance, net asset value, dividends, press releases, and shareholder reports. For further information, please email us at info@globalincomefund.net.
MANAGED DISTRIBUTIONS
The Board’s current policy is to provide investors with a stable quarterly distribution out of current income, supplemented by realized capital gains, and to the extent necessary, paid in capital. The Fund is subject to U.S. corporate, tax, and securities laws. Under U.S. tax accounting rules, the amount of distributable net income is determined on an annual basis and is dependent during the fiscal year on the aggregate gains and losses realized by the Fund and, to a lesser extent, the actual exchange rate between the U.S. dollar and the currencies in which Fund assets are denominated. Therefore, the exact amount of distributable income can only be determined as of the end of the Fund’s fiscal year. Under the Investment Company Act of 1940, as amended, however, the Fund is required to indicate the source of each distribution to shareholders. The Fund estimates that distributions for the fiscal period commencing January 1, 2010, including the distributions paid quarterly, will be comprised primarily from net investment income and the balance from paid in capital. This estimated distribution composition may vary from quarter to quarter because it may be materially impacted by future realized gains and losses on securities and fluctuations in the value of currencies in which Fund assets are denominated. After each fiscal year, a Form 1099-DIV will be sent to shareholders stating the amount and composition of distributions and providing information about their appropriate tax treatment.
DIVIDEND REINVESTMENT PLAN
Terms and Conditions of the
2008 Amended Dividend Reinvestment Plan
1. Each shareholder (the “Shareholder”) holding shares of common stock (the “Shares”) of Global Income Fund, Inc. (the “Fund”) will automatically be a participant in the Dividend Reinvestment Plan (the “Plan”), unless the Shareholder specifically elects to receive all dividends and capital gains in cash paid by check mailed directly to the Shareholder by Illinois Stock Transfer Company, 209 West Jackson Blvd., Suite 903, Chicago, Illinois 60606, 1-800-757-5755, as agent under the Plan (the “Agent”). The Agent will open an account for each Shareholder under the Plan in the same name in which such Shareholder's shares of Common Stock are registered.
2. Whenever the Fund declares a capital gain distribution or an income dividend payable in Shares or cash, participating Shareholders will take the distribution or dividend entirely in Shares and the Agent will automatically receive the Shares, including fractions, for the Shareholder’s account in accordance with the following:
Whenever the Market Price (as defined in Section 3 below) per Share is equal to or exceeds the net asset value per Share at the time Shares are valued for the purpose of determining the number of Shares equivalent to the cash dividend or capital gain distribution (the “Valuation Date”), participants will be issued additional Shares equal to the amount of such dividend divided by the greater of the Fund’s net asset value per Share or 95% of the Fund’s Market Price per Share. Whenever the Market Price per Share is less than such net asset value on the Valuation Date, participants will be issued additional Shares equal to the amount of such dividend divided by the Market Price. The Valuation Date is the day before the dividend or distribution payment date or, if that day is not a business day, the next business day. If the Fund should declare a dividend or capital gain distribution payable only in cash, the Agent will, as purchasing agent for the participating Shareholders, buy Shares in the open market, or elsewhere, for such Shareholders' accounts after the payment date, except that the Agent will endeavor to terminate purchases in the open market and cause the Fund to issue the remaining Shares if, following the commencement of the purchases, the market value of the Shares exceeds the net asset value. These remaining Shares will be issued by the Fund at a price equal to the Market Price.
In a case where the Agent has terminated open market purchases and caused the issuance of remaining Shares by the Fund, the number of Shares received by the participant in respect of the cash dividend or distribution will be based on the weighted average of prices paid for Shares purchased in the open market and the price at which the Fund issues remaining Shares. To the extent that the Agent is unable to terminate purchases in the open market before the Agent has completed its purchases, or remaining Shares cannot be issued by the Fund because the Fund declared a dividend or distribution payable only in cash, and the market price exceeds the net asset value of the Shares, the average Share purchase price paid by the Agent may exceed the net asset value of the Shares, resulting in the acquisition of fewer Shares than if the dividend or capital gain distribution had been paid in Shares issued by the Fund.
The Agent will apply all cash received as a dividend or capital gain distribution to purchase shares of common stock on the open market as soon as practicable after the payment date of the dividend or capital gain distribution, but in no event later than 45 days after that date, except when necessary to comply with applicable provisions of the federal securities laws.
3. For all purposes of the Plan: (a) the Market Price of the Shares on a particular date shall be the average of the volume weighted average sale prices or, if no sale occurred then the mean between the closing bid and asked quotations, for the Shares on each of the five trading days the Shares traded ex-dividend immediately prior to such date, and (b) net asset value per share on a particular date shall be as determined by or on behalf of the Fund.
4. The open market purchases provided for herein may be made on any securities exchange on which the Shares are traded, in the over the counter market, or in negotiated transactions, and may be on such terms as to price, delivery and otherwise as the Agent shall determine. Funds held by the Agent uninvested will not bear interest, and it is understood that, in any event, the Agent shall have no liability in connection with any inability to purchase Shares within 45 days after the initial date of such purchase as herein provided, or with the timing of any purchases effected. The Agent shall have no responsibility as to the value of the Shares acquired for the Shareholder's account.
5. The Agent will hold Shares acquired pursuant to the Plan in noncertificated form in the Agent’s name or that of its nominee. At no additional cost, a Shareholder participating in the Plan may send to the Agent for deposit into its Plan account those certificate shares of the Fund in its possession. These Shares will be combined with those unissued full and fractional Shares acquired under the Plan and held by the Agent. Shortly thereafter, such Shareholder will receive a statement showing its combined holdings. The Agent will forward to the Shareholder any proxy solicitation material and will vote any Shares so held for the Shareholder only in accordance with the proxy returned by the Shareholder to the Fund. Upon the Shareholder's written request, the Agent will deliver to him or her, without charge, a certificate or certificates for the full Shares.
6. The Agent will confirm to the Shareholder each acquisition for the Shareholder’s account as soon as practicable but not later than 60 days after the date thereof. Although the Shareholder may from time to time have an individual fractional interest (computed to three decimal places) in a Share, no certificates for fractional Shares will be issued. However, dividends and distributions on fractional Shares will be credited to Shareholders’ accounts. In the event of a termination of a Shareholder’s account under the Plan, the Agent will adjust for any such undivided fractional interest in cash at the opening market value of the Shares at the time of termination.
7. Any stock dividends or split Shares distributed by the Fund on Shares held by the Agent for the Shareholder will be credited to the Shareholder’s account. In the event that the Fund makes available to the Shareholder the right to purchase additional Shares or other securities, the Shares held for a Shareholder under the Plan will be added to other Shares held by the Shareholder in calculating the number of rights to be issued to such Shareholder. Transaction processing may either be curtailed or suspended until the completion of any stock dividend, stock split, or corporate action.
8. The Agent’s service fee for handling capital gain distributions or income dividends will be paid by the Fund. The Shareholder will be charged a pro rata share of brokerage commissions on all open market purchases.
9. The Shareholder may terminate the account under the Plan by notifying the Agent. A termination will be effective immediately if notice is received by the Agent two days prior to any dividend or distribution payment date. If the request is received less than two days prior to the payment date, then that dividend will be invested, and all subsequent dividends will be paid in cash. Upon any termination the Agent will cause a certificate or certificates for the full Shares held for the Shareholder under the Plan and cash adjustment for any fraction to be delivered to the Shareholder.
10. These terms and conditions may be amended or supplemented by the Fund at any time or times but, except when necessary or appropriate to comply with applicable law or the rules or policies of the Securities and Exchange Commission or any other regulatory authority, only by mailing to the Shareholder appropriate written notice at least 30 days prior to the effective date thereof. The amendment or supplement shall be deemed to be accepted by the Shareholder unless, prior to the effective date thereof, the Agent receives written notice of the termination of such Shareholder’s account under the Plan. Any such amendment may include an appointment by the Fund of a successor agent in its place and stead under these terms and conditions, with full power and authority to perform all or any of the acts to be performed by the Agent. Upon any such appointment of an Agent for the purpose of receiving dividends and distributions, the Fund will be authorized to pay to such successor Agent all dividends and distributions payable on Shares held in the Shareholder’s name or under the Plan for retention or application by such successor Agent as provided in these terms and conditions.
11. In the case of Shareholders, such as banks, brokers or nominees, which hold Shares for others who are the beneficial owners, the Agent will administer the Plan on the basis of the number of Shares certified from time to time by the Shareholders as representing the total amount registered in the Shareholder’s name and held for the account of beneficial owners who are to participate in the Plan.
12. The Agent shall at all times act in good faith and agree to use its best efforts within reasonable limits to insure the accuracy of all services performed under this agreement and to comply with applicable law, but assumes no responsibility and shall not be liable for loss or damage due to errors unless the errors are caused by its negligence, bad faith or willful misconduct or that of its employees.
13. Neither the Fund or the Agent will be liable for any act performed in good faith or for any good faith omission to act, including without limitation, any claim of liability arising out of (i) failure to terminate a Shareholder’s account, sell shares or purchase shares, (ii) the prices which shares are purchased or sold for the Shareholder’s account, and (iii) the time such purchases or sales are made, including price fluctuation in market value after such purchases or sales.
| This report, including the financial statements herein, is transmitted to the shareholders of the Fund for their information. The financial information included herein is taken from the records of the Fund. This is not a prospectus, circular, or representation intended for use in the purchase of shares of the Fund or any securities mentioned in this report. Pursuant to Section 23 of the Investment Company Act of 1940, as amended, notice is hereby given that the Fund may in the future purchase shares of its own common stock in the open market. These purchases may be made from time to time, at such times, and in such amounts, as may be deemed advantageous to the Fund, although nothing herein shall be considered a commitment to purchase such shares. |
|
HISTORICAL DISTRIBUTION SUMMARY
|
|
| |
|
| |
|
Investment
|
|
|
Return of
|
|
|
|
|
|
Period
|
|
Income
|
|
|
Capital
|
|
|
Total
|
|
|
6 Months Ended 6/30/10*
|
|
$ |
0.110 |
|
|
$ |
0.000 |
|
|
$ |
0.110 |
|
|
2009
|
|
$ |
0.235 |
|
|
$ |
0.000 |
|
|
$ |
0.235 |
|
|
2008
|
|
$ |
0.240 |
|
|
$ |
0.000 |
|
|
$ |
0.240 |
|
|
2007
|
|
$ |
0.170 |
|
|
$ |
0.050 |
|
|
$ |
0.220 |
|
|
2006
|
|
$ |
0.130 |
|
|
$ |
0.150 |
|
|
$ |
0.280 |
|
|
2005
|
|
$ |
0.200 |
|
|
$ |
0.080 |
|
|
$ |
0.280 |
|
|
2004
|
|
$ |
0.245 |
|
|
$ |
0.090 |
|
|
$ |
0.335 |
|
|
2003
|
|
$ |
0.220 |
|
|
$ |
0.140 |
|
|
$ |
0.360 |
|
|
2002
|
|
$ |
0.280 |
|
|
$ |
0.220 |
|
|
$ |
0.500 |
|
|
2001
|
|
$ |
0.360 |
|
|
$ |
0.200 |
|
|
$ |
0.560 |
|
|
2000
|
|
$ |
0.420 |
|
|
$ |
0.160 |
|
|
$ |
0.580 |
|
|
6 Months Ended 12/31/99
|
|
$ |
0.230 |
|
|
$ |
0.070 |
|
|
$ |
0.300 |
|
|
12 Months Ended 6/30/99
|
|
$ |
0.550 |
|
|
$ |
0.130 |
|
|
$ |
0.680 |
|
|
12 Months Ended 6/30/98
|
|
$ |
0.520 |
|
|
$ |
0.320 |
|
|
$ |
0.840 |
|
* The majority, and possibly all, of the 2010 distribution may be comprised of net investment income. This is only an estimate based on information available at this time and is subject to change. Actual amounts may be recharacterized between net investment income and return of capital for tax purchases after year end 2010, although the exact amount is not estimable at June 30, 2010.
| STOCK DATA |
|
2010 DISTRIBUTION DATES |
|
Price (6/30/10)
|
$3.43 |
|
|
|
|
| Net asset value (6/30/10) |
$4.21 |
|
Declaration |
Record |
Payment |
| Discount |
18.5% |
|
March 1 |
March 15 |
March 31 |
| Ticker |
GIFD |
|
June 1 |
June 15 |
June 30 |
| |
|
|
September 1 |
September 15 |
September 30 |
| |
|
|
December 1 |
December 15 |
December 31 |
| FUND INFORMATION |
| |
| Investment Manager |
|
Stock Transfer Agent and Registrar |
| CEF Advisers, Inc. |
|
IST Shareholder Services |
| 11 Hanover Square |
|
209 West Jackson Blvd., Suite 903 |
| New York, NY 10005 |
|
Chicago, IL 60606 |
| www.cefadvisers.com |
|
www.ilstk.com |
| 1-212-344-6310 |
|
1-800-757-5755 |
| |
|
|
DIRECTORS AND OFFICERS
The following table sets forth certain information concerning the Directors currently serving on the Board of the Fund. Unless otherwise noted, the address of record for the directors and officers is 11 Hanover Square, New York, New York 10005.
|
Name, Position(s) Held with Fund, Term of Office(1), Principal Occupation for Past Five Years, and Age
|
Director Since
|
Number of Portfolios
in Investment
Company Complex
Overseen by Director(2)
|
Other Public
Company
Directorships
Held by Director(3)
|
| |
|
|
|
|
Class I:
|
|
|
|
|
PETER K. WERNER – Since 1996, he has been teaching, coaching, and directing a number of programs at The Governor's Academy of Byfield, MA. Currently, he serves as chair of the History Department. Previously, he held the position of Vice President in the Fixed Income Departments of Lehman Brothers and First Boston. His responsibilities included trading sovereign debt instruments, currency arbitrage, syndication, medium term note trading, and money market trading. He was born on August 16, 1959.
|
1997
|
5
|
0
|
| |
|
|
|
|
Class II:
|
|
|
|
|
JAMES E. HUNT – He is a Limited Partner of Hunt Howe Partners LLC, executive recruiting consultants. He was born on December 14, 1930.
|
2004
|
5
|
0
|
| |
|
|
|
|
Class III:
|
|
|
|
|
BRUCE B. HUBER, CLU, ChFC, MSFS – Retired. He is a former Financial Representative with New England Financial, specializing in financial, estate, and insurance matters. He is a member of the Board, emeritus, of the Millbrook School, and Chairman of the Endowment Board of the Community YMCA of Red Bank, NJ. He was born on February 7, 1930.
|
2004
|
5
|
0
|
| |
|
|
|
|
Class IV:
|
|
|
|
|
THOMAS B. WINMILL, ESQ. (4) – He is President, Chief Executive Officer, and General Counsel of the Fund, the Investment Manager, the other investment companies in the Investment Company Complex, and of Winmill & Co. Incorporated and its affiliates (“WCI”). He is a member of the New York State Bar and the SEC Rules Committee of the Investment Company Institute. He is the son of Bassett S. Winmill. He was born on June 25, 1959.
|
1997
|
5
|
Eagle Bulk
Shipping Inc.
|
|
Name, Position(s) Held with Fund, Term of Office(1), Principal Occupation for Past Five Years, and Age
|
Director Since
|
Number of Portfolios
in Investment
Company Complex
Overseen by Director(2)
|
Other Public
Company
Directorships
Held by Director(3)
|
| |
|
|
|
|
Class V:
|
|
|
|
|
BASSETT S. WINMILL(4) – He is Chairman of the Board of the Fund, the other investment company advised by the Investment Manager, and WCI. He is Chief Investment Strategist of the Investment Manager. He is a member of the New York Society of Security Analysts, the Association for Investment Management and Research, and the International Society of Financial Analysts. He is the father of Thomas B. Winmill. He was born on February 10, 1930.
|
1997
|
2
|
0
|
(1) Directors not elected annually shall be deemed to be continuing in office until after the time at which an annual meeting is required to be held under Maryland law, the Fund’s Charter or Bylaws, the Act, or other applicable law.
(2) The “Investment Company Complex” (“ICC”) is comprised of the Fund, Foxby Corp., Midas Fund, Inc., Midas Perpetual Portfolio, Inc., and Midas Special Fund, Inc. Foxby Corp. is advised by the Investment Manager and the Midas Funds are advised by an affiliate of the Investment Manager.
(3) Refers to directorships held by a director in any company with a class of securities registered pursuant to Section 12 of the Securities Exchange Act of 1934 or any company registered as an investment company under the Act, excluding those within the ICC.
(4) He is an “interested person” of the Fund as defined in the Act due to his affiliation with the Investment Manager.
Messrs. Huber, Hunt, and Werner also serve on the Audit and Nominating Committees of the Board. Mr. Thomas Winmill also serves on the Executive Committee of the Board.
The executive officers, other than those who serve as Directors, and their relevant biographical information are set forth below.
|
Name and Age
|
Position(s) Held with Fund, Term of Office*, Principal Occupation for the Past Five Years
|
| |
|
|
Thomas O’Malley
Born on July 22, 1958
|
Chief Accounting Officer, Chief Financial Officer, and Vice President since 2005. He is also Chief Accounting Officer, Chief Financial Officer, and Vice President of the ICC, the Investment Manager, and WCI. Previously, he served as Assistant Controller of Reich & Tang Asset Management, LLC, Reich & Tang Services, Inc., and Reich & Tang Distributors, Inc. He is a certified public
accountant.
|
| |
|
|
John F. Ramirez, Esq.
Born on April 29, 1977
|
Secretary, Chief Compliance Officer, and Vice President since 2005 and Associate General Counsel since 2009. He is also Secretary, Chief Compliance Officer, Associate General Counsel, and Vice President of the ICC, the Investment Manager, and WCI. He is a member of the New York State Bar and the Chief Compliance Officer Committee and Compliance Advisory Committee of the Investment Company Institute.
|
|
*
|
Officers hold their positions with the Fund until a successor has been duly elected and qualifies. Officers are generally elected annually at the December meeting of the Board of Directors. The officers were last elected on December 9, 2009.
|
|
GLOBAL
INCOME
|
|
|
|
FUND
|
|
|
| |
|
|
|
11 Hanover Square
|
|
|
|
New York, NY 10005
|
|
|
Item 2. Code of Ethics.
Not applicable.
Item 3. Audit Committee Financial Expert.
Not applicable.
Item 4. Principal Accountant Fees and Services.
Not applicable.
Item 5. Audit Committee of Listed Registrants.
Not applicable.
Item 6. Investments.
Included as part of the report to stockholders filed under Item 1 of this Form.
Item 7. Disclosure of Proxy Voting Policies and Procedures for Closed-End Management Investment Companies.
Not applicable.
Item 8. Portfolio Managers of Closed-End Management Investment Companies.
Not applicable.
Item 9. Purchases of Equity Securities by Closed-End Management Investment Company and Affiliated Purchase.
Not applicable.
Item 10. Submission of Matters to a Vote of Security Holders.
There were no material changes to the procedures by which shareholders may recommend nominees to the registrant's board of directors made or implemented after the registrant last provided disclosure in response to the requirements of Item 407(c)(2)(iv) of Regulation S-K (17 CFR 229.407), or this Item.
Item 11. Controls and Procedures.
|
(a)
|
The registrant's principal executive officer and principal financial officer have concluded that the registrant's disclosure controls and procedures (as defined in Rule 30a- 3(c) under the Investment Company Act of 1940, as amended (the "1940 Act")) are effective as of a date within 90 days of the filing date of this report that includes the disclosure required by this paragraph, based on their evaluation of the disclosure controls and procedures required by Rule 30a-3(b) under the 1940 Act and 15d-15(b) under the Securities Exchange Act of 1934.
|
|
(b)
|
There were no changes in the registrant's internal control over financial reporting (as defined in Rule 30a-3(d) under the 1940 Act) that occurred during the registrant's most recent fiscal quarter of the period covered by the report that have materially affected, or are likely to materially affect the registrant's internal control over financial reporting.
|
Item 12. Exhibits.
|
(a)
|
Certifications pursuant to Rule 30a-2(a) under the Investment Company Act of 1940(17 CFR 270.360a-2) attached hereto as Exhibits EX-31 and certifications pursuant to 18 U.S.C. Section 1350, as adopted pursuant to Section 906 of the Sarbanes-Oxley Act of 2002 attached hereto as Exhibit EX-32.
|
SIGNATURES
Pursuant to the requirements of the Securities Exchange Act of 1934 and the Investment Company Act of 1940, the registrant has duly caused this report to be signed on its behalf by the undersigned, thereunto duly authorized.
| |
Global Income Fund, Inc.
|
| |
|
|
September 7, 2010
|
By: /s/ Thomas B. Winmill
|
| |
Thomas B. Winmill, President
|
| |
|
| |
|
| |
Global Income Fund, Inc.
|
| |
|
|
|
By: /s/ Thomas O’Malley
|
| |
Thomas O’Malley, Chief Financial Officer
|
| |
|
| |
|
Pursuant to the requirements of the Securities Exchange Act of 1934 and the Investment Company Act of 1940, the registrant has duly caused this report to be signed below by the following persons on behalf of the registrant and in the capacities and on the dates indicated.
| |
Global Income Fund, Inc.
|
| |
|
|
|
By: /s/ Thomas B. Winmill
|
| |
Thomas B. Winmill, President
|
| |
|
| |
|
| |
Global Income Fund, Inc.
|
| |
|
|
|
By: /s/ Thomas O’Malley
|
| |
Thomas O’Malley, Chief Financial Officer
|
| |
|
| |
|